

viniciusluciano
-
Posts
6 -
Cadastrado em
-
Última visita
-
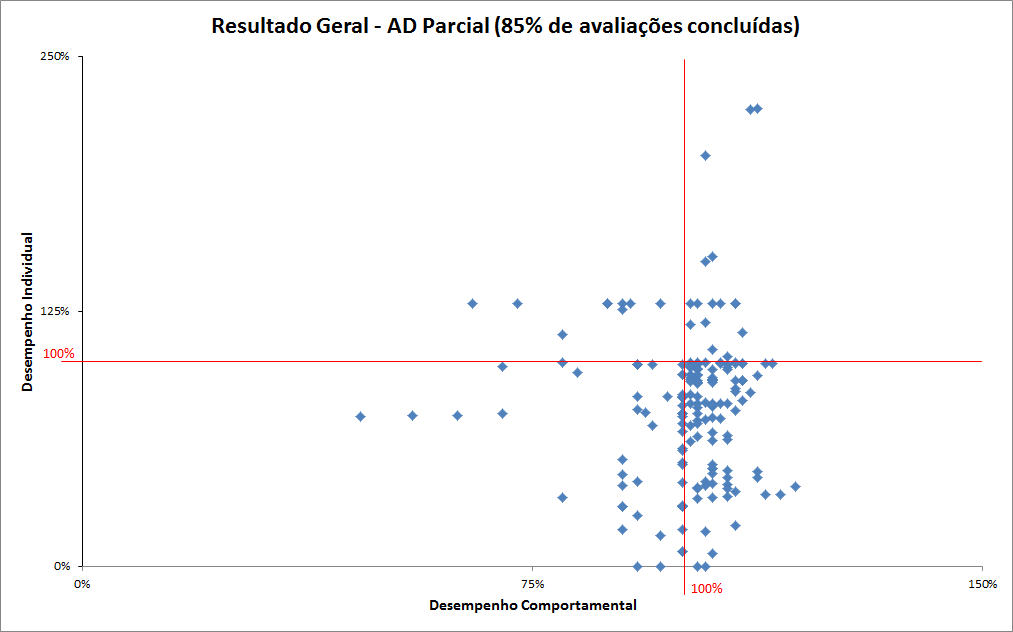
Gráfico de Dispersão - Ponto de Destaque
viniciusluciano postou um tópico em Microsoft Office e similares
Pessoal, Tenho um gráfico de dispersão que mede a performance individual (x) e o cumprimento de meta (y) da minha equipe de TI, porém estou falando de muitos funcionários (+300) Consegui uma macro que rotule todos os nomes no gráfico!! Mas eu preciso de uma forma de destacar no gráfico, seja por cor ou por nome um determinado funcionário para mostrar como ele se posiciona diante do time todo. Anexo o gráfico que tenho pronto e quero usar. No aguardo e obrigado!
-
Considere utilizar a macro abaixo, tendo o grafico como ativo (selecionado)... pra mim ajudou! Abraços! Sub AttachLabelsToPoints() 'Dimension variables. Dim Counter As Integer, ChartName As String, xVals As String ' Disable screen updating while the subroutine is run. Application.ScreenUpdating = False 'Store the formula for the first series in "xVals". xVals = ActiveChart.SeriesCollection(1).Formula 'Extract the range for the data from xVals. xVals = Mid(xVals, InStr(InStr(xVals, ","), xVals, _ Mid(Left(xVals, InStr(xVals, "!") - 1), 9))) xVals = Left(xVals, InStr(InStr(xVals, "!"), xVals, ",") - 1) Do While Left(xVals, 1) = "," xVals = Mid(xVals, 2) Loop 'Attach a label to each data point in the chart. For Counter = 1 To Range(xVals).Cells.Count ActiveChart.SeriesCollection(1).Points(Counter).HasDataLabel = _ True ActiveChart.SeriesCollection(1).Points(Counter).DataLabel.Text = _ Range(xVals).Cells(Counter, 1).Offset(0, -1).Value Next Counter End Sub
-
Pessoal boa tarde! <br /> Estou com um Vaio i5, comprado em 2012, bem bacana o note. <br /> E por algum motivo eu fiz besteira quando tentei recuperar os padrões de fábrica e perdi minha Restore.<br /> Então pensei em formatar tudo e instalar o Windows 7 do zero, sem segundas partições. <br /> Porém ele quando termina a primeira etapa da instalação e reinicia ele volta ao setup e quando está prestes a terminar de instalar ele dá esse erro.<br /> <br /> Já verifiquei e meu HD aparece no menu da Bios. Já tentei Chkdsk, bootrec.exe fixmbr, Boot repair, mas nada parece funcionar... <br /> Deixei o Boot em Legacy achando que resolveria e também nada.<br /> <br /> Alguém tem alguma sugestão? Procurei no Google em inglês e também não acho nada que finalmente resolva.<br /> Abraços e obrigado
Sobre o Clube do Hardware
No ar desde 1996, o Clube do Hardware é uma das maiores, mais antigas e mais respeitadas comunidades sobre tecnologia do Brasil. Leia mais
Direitos autorais
Não permitimos a cópia ou reprodução do conteúdo do nosso site, fórum, newsletters e redes sociais, mesmo citando-se a fonte. Leia mais